Honours thesis, University of Sydney, 2025
Supervised by Dr. Li Wei, University of Sydney Nano Institute (Sydney Nano).
Core skills: Excel modelling and engineering economics
I built an Excel model to estimate the output, electricity consumption and production cost of a small electrochemical unit. Through the model calculations and the scenarios compared in my thesis, I examined how user demand, equipment size, power supply and component life affect production costs.
Supply design and model result
I calculated the equipment configuration needed to supply 1 tonne per year of 6 wt% hydrogen peroxide solution, using an assumed Faradaic efficiency of 95%, a single-cell voltage of 1.17 V and a baseline capacity factor of 90%.
Rounding up to the preset minimum module size gave a configuration of one 5 kW module, with theoretical capacity sufficient to meet that annual demand.
The 1 tonne figure is the annual demand used in the model, rather than the unit’s maximum annual output. This configuration is a design estimate based on published performance and engineering assumptions; it has not been validated in an operating unit. The operating schedule would need to be adjusted to actual demand.
What I built in Excel
I brought together published electrochemical performance data and engineering assumptions to calculate production and power requirements. The model estimated peroxide output from current density, electrode area and Faradaic efficiency, and electrical power from cell voltage and current. I then used annual demand and the assumed operating hours to estimate the required equipment size.
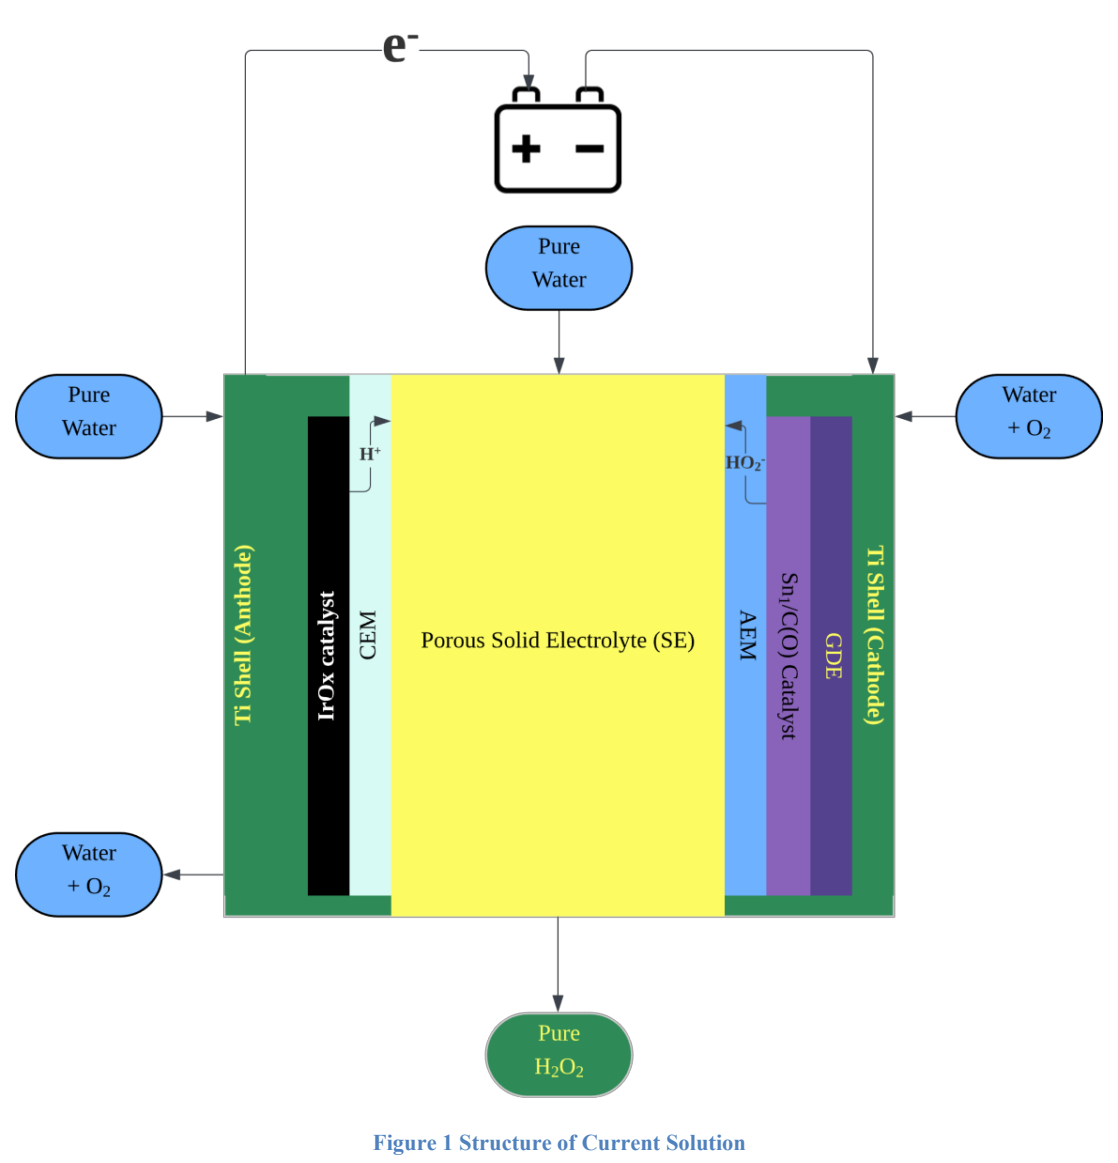
For the capital estimate, I calculated membrane, catalyst and diffusion-layer quantities from electrode area and catalyst loading. I used supplier prices and literature data to estimate their costs, then added housing, supporting equipment and installation.
To compare costs over the life of the equipment, I used a capital recovery factor to convert the initial investment into an equivalent annual cost. I added electricity, water, oxygen, maintenance and component replacement. Membrane and catalyst replacement costs were calculated separately from their assumed service lives and the annual operating hours.
I also calculated the cost of purchasing peroxide externally, including transport, handling and storage, to compare the two ways of supplying the user.
What the analysis showed
The minimum module size can exceed a small user’s needs
The modelled demand of 1 tonne of solution corresponds to 60 kg of pure hydrogen peroxide per year. Rounding up to the preset minimum module size gave a single-module configuration, but its capacity could exceed actual consumption. Meeting the annual demand therefore did not mean that all the available capacity would be used.
The thesis considered supplying nearby users, but demand from those customers had not been established. Assessing the economics required distinguishing potential output from actual consumption, rather than relying on rated production capacity alone.
Power supply affects unit cost through equipment utilisation
I compared grid electricity, solar-only operation without batteries, and solar with grid backup. The scenarios assumed capacity factors of 90%, 20–25% and 50–80%, respectively. These were illustrative assumptions.
Holding equipment size and specific energy consumption constant, those capacity factors imply that solar-only annual output would be approximately 22–28% of grid-supplied output. This ratio is calculated from the thesis assumptions; it is not a measured production result.
When the power supply limits operating hours, the same equipment produces less peroxide each year. Meeting the same annual demand may then require more installed capacity, while annualised capital costs are spread over less product.
The comparison therefore needed to consider electricity price, equipment utilisation and equipment size together. Solar with grid backup offered a way to maintain operation when solar power was unavailable, but the study did not establish it as the lowest-cost option.
Component life affects recurring operating costs
Membrane and catalyst lifetimes were specified in operating hours. Running the equipment for longer increases annual output, but also brings components to their assumed replacement intervals sooner and increases annual replacement expenditure.
The workbook’s baseline configuration used an effective electrode area of 1.35 m² and 7,884 operating hours per year. Recalculating from its component prices and lifetime assumptions gave an annualised replacement material cost of approximately USD 7,000 for the membrane and two catalyst types. The membrane accounted for approximately USD 4,300, or 61% of those replacement material costs.
These are baseline model estimates, excluding replacement labour, downtime and waste disposal. They are not recorded operating costs from a working unit. The result highlights why membrane life and replacement frequency need separate attention when assessing long-term costs.
What I delivered and what comes next
I completed the Excel model and documented its methods, assumptions and comparisons in my thesis. The model allowed me to estimate output and cost for a given equipment performance, user demand and set of operating conditions, and to assess the economic feasibility of on-site peroxide production.
The study relied mainly on literature and supplier data, and the calculations have not been validated in an operating unit. Using the assessment for a project decision would require long-term component data, site-specific demand and electricity information, and a review of the calculations for each power-supply scenario.
Study scope: the power-supply ratios and component costs above are based on assumptions. Absolute annual output, unit production cost and the cost difference from external purchasing remain provisional until the pure-peroxide and product-solution mass bases are reconciled and the cost formulas are checked.